1. Introduction
Undergraduate engineering students frequently struggle to learn and retain the structured query language (SQL), even after completing lectures, in-class exercises, and homework (Lahtinen et al., 2005; Robins et al., 2003). In our prior course offerings, students demonstrated rapid decay of SQL competence within weeks, a pattern consistent with research showing that declarative knowledge and syntax-heavy skills require repeated and varied practice to achieve fluency (Anderson, 2013; Cepeda et al., 2006; DeKeyser, 2020; Ericsson et al., 1993). To address this challenge, we developed the Deliberate Practice Engine, an adaptive e-learning platform that provides individualized SQL practice with immediate feedback and gamified elements. Earlier work demonstrated that the system substantially increases student engagement and supports improvement in SQL accuracy during practice sessions (Campbell, 2018; Fiegel et al., 2025; Yazvec, 2020).
This study extends our previous Deliberate Practice Engine work by examining whether the Engine’s gamified confidence-wagering mechanism provides insight into students’ metacognitive processes during practice, and whether those processes are linked to subsequent performance on a summative SQL assessment. Deliberate practice theory suggests that learners improve most efficiently when they repeatedly engage in progressively challenging tasks while monitoring their performance and adjusting their strategies accordingly (Anders Ericsson, 2008; Azevedo & Aleven, 2013; Hambrick et al., 2014; VanLehn, 2011). The Deliberate Practice Engine operationalizes this principle by adapting question difficulty to each learner’s demonstrated proficiency and by offering iterative feedback on open-ended SQL queries. It also incorporates a point-based wagering feature that requires students to express their confidence before submitting an answer. Such confidence judgments are widely used as behavioral indicators of metacognitive monitoring, the ability to assess one’s own knowledge state, and have been linked to improved self-regulated learning and higher academic achievement (Dunlosky & Metcalfe, 2008; Fleming, 2024; Koriat, 2006; Mahdavi, 2014; Nelson, 1990; Veenman et al., 2006).
Metacognition researchers distinguish between monitoring (evaluating what one knows) and control (regulating study behavior based on that evaluation) (Fischhoff et al., 1977; Keren, 1991; Nelson, 1990; Schraw & Dennison, 1994; Son & Schwartz, 2002). In learning environments that provide frequent practice opportunities, well-calibrated confidence judgments, high confidence when correct, low confidence when incorrect, are commonly interpreted as evidence of productive monitoring and control (Mayer & Alexander, 2017). Because the Deliberate Practice Engine captures explicit confidence signals on every initial attempt, it provides a unique opportunity to study how students calibrate their knowledge while learning a technical skill and whether those behaviors differ for novice and more advanced students.
This study investigates whether wager size functions as a meaningful proxy for metacognition and whether metacognitive wagering patterns help explain performance on a subsequent SQL exam. We analyze data from two consecutive offerings of a sophomore-level engineering course, examining 18,391 metacognitive responses generated by 66 students. Our analysis focuses on two related questions:
H1 (Metacognitive Monitoring)
Wager size will be positively associated with the likelihood of a correct response. Students who place larger wagers on items they answer correctly and smaller wagers on items they answer incorrectly demonstrate metacognitive alignment.
H2 (Performance Prediction)
Students who exhibit stronger metacognitive alignment during practice will perform better on the SQL portion of the course’s summative assessment.
By linking students’ moment-to-moment practice behavior to independent assessment outcomes, this study contributes to the growing body of work on gamification, metacognition, and deliberate practice in engineering education (Ishaq et al., 2024; Zeng et al., 2024). It also offers practical implications for designing instructional tools that support metacognitive development, particularly for early-career engineering students who may lack well-formed learning strategies.
2. Methods
Course Context and Participants
This study was approved by the University of Iowa Institutional Review Board (IRB #201908712). This was a retrospective study, and all data were de-identified prior to analysis.
This study analyzed data from two consecutive offerings of a sophomore-level Industrial Engineering course at a large Midwestern university. The course includes a two-week module introducing students to SQL through short lectures followed by extensive deliberate practice using the Deliberate Practice Engine. Sixty-six students participated and the course data was augmented with anonymized data for both the 2024 (n = 24) and 2025 (n = 42) offerings. First- and second-year students were classified as lower-division (n = 42), and third- and fourth-year students (plus a graduate students) as upper-division (n = 24). Participation with the system was part of normal coursework, and none of the analyses influenced students’ grades.
Students were assigned weekly proficiency targets within the platform and completed a summative exam that included a common SQL component during week six of the course.
The Deliberate Practice Engine
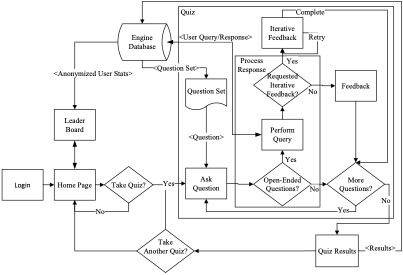
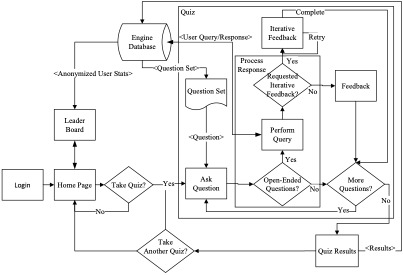
The Deliberate Practice Engine is an adaptive practice system that delivers SQL questions and provides students with immediate correctness feedback and opportunities for iterative refinement. Each quiz presents up to eight items drawn from a pool of 204 questions that span multiple SQL topics and three levels of conceptual progression (Basic, Intermediate, and Advanced). The system selects questions based on a student’s current proficiency in each topic; Figure 1 illustrates the overall flow from login to quiz initiation, to feedback and progression.
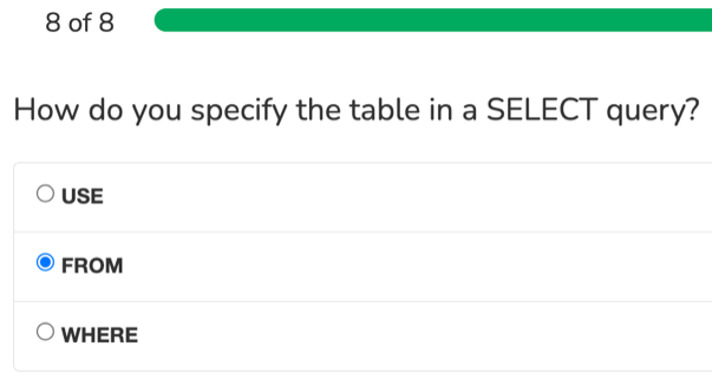
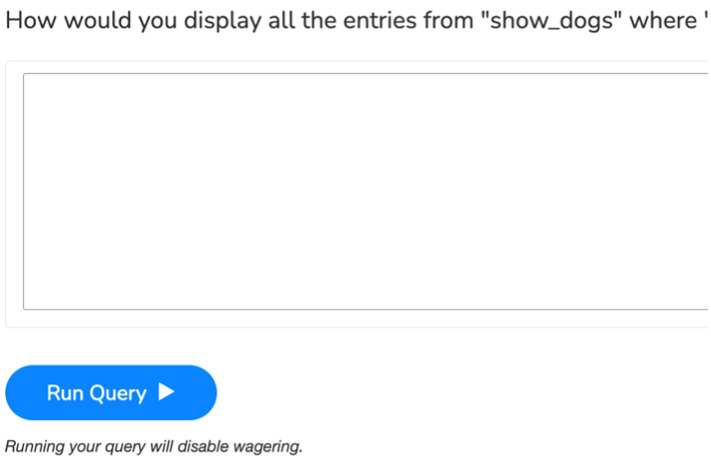
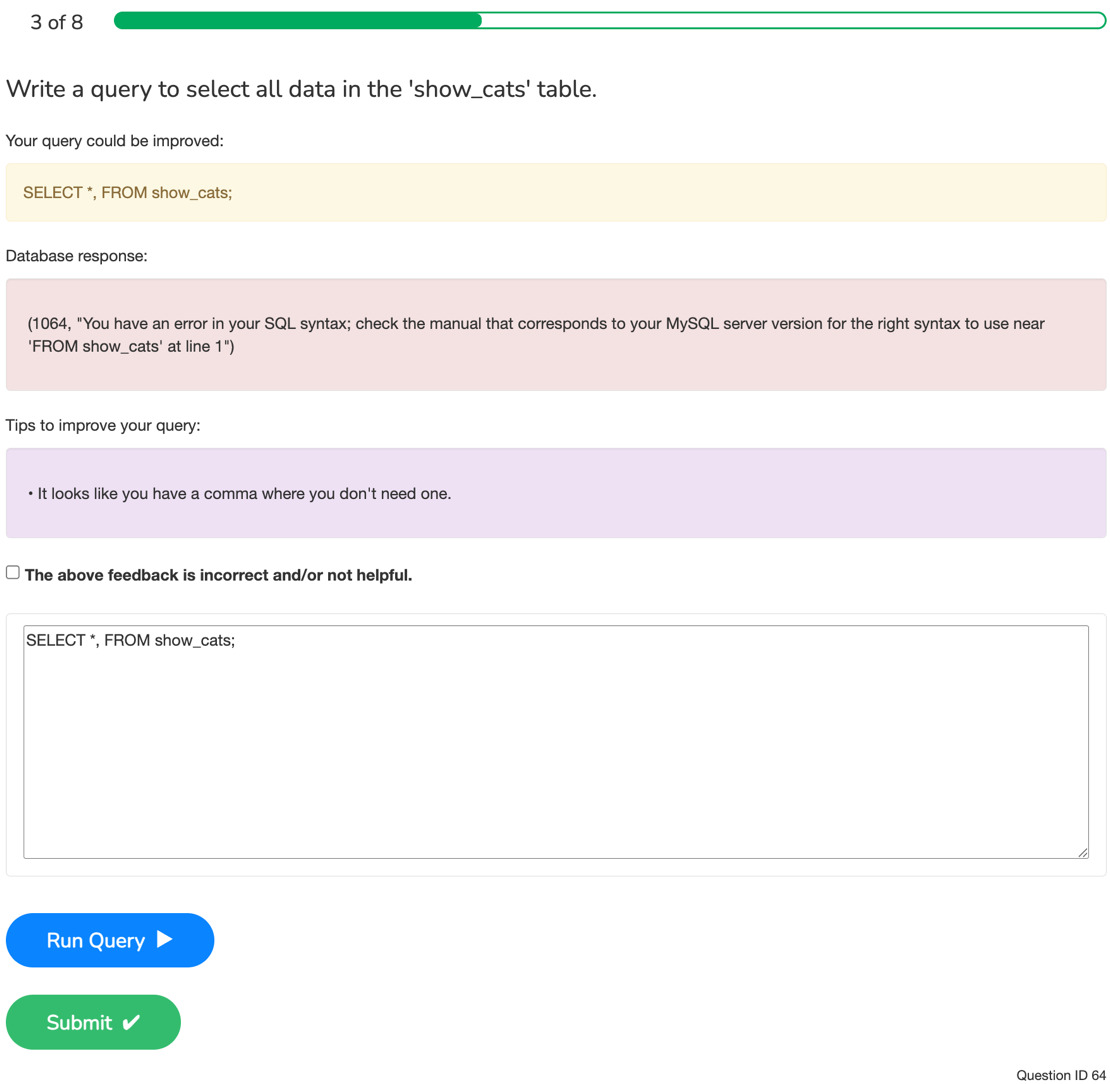
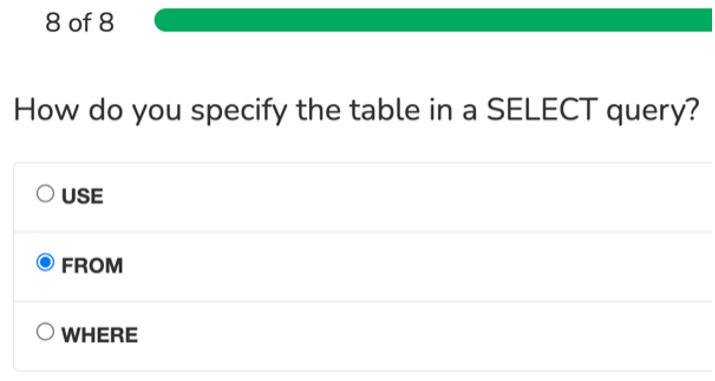
Questions vary in difficulty and format. Easy and intermediate questions are typically multiple-choice or true/false (Figure 2), while most hard questions require students to write complete SQL queries (Figure 3). For open-ended questions, students may request iterative feedback and iteratively run their query against the MySQL database. The system then returns the database output along with tailored hints designed to guide revision (Figure 4). Students may revise and resubmit open-ended answers until they choose to submit a final response. Because these iterative attempts are scaffolded and do not require students to express confidence, only the first attempt on each open-ended item is treated as a metacognitive response in our analyses.
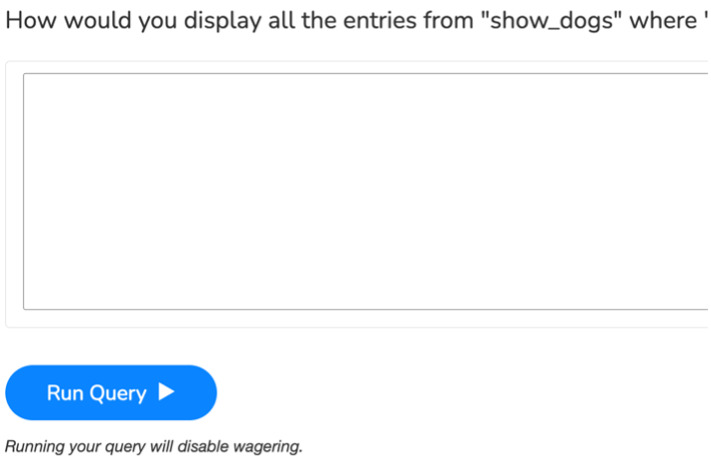

A point-based wagering feature integrates a confidence judgment directly into practice. Before submitting each initial response, students may wager 0, 25, 50, 75, or 100 points; open-ended questions additionally allow an “All-In” wager that risks the student’s entire point balance. Correct answers earn the wagered points along with a 10-point bonus, and incorrect answers lose the wagered points. Point totals reset to 0 if a loss exceeds the current balance. This wagering mechanism provides a behavioral proxy for metacognitive monitoring, because students indicate how confident they are in their answer before receiving feedback.
Data Sources and Measures
The Deliberate Practice Engine logs detailed information about each question attempt, including the student’s wager, whether the response was correct, the response time, the question’s difficulty level, the topic area, and whether the item was multiple-choice or open-ended. To capture only those attempts in which confidence was expressed, we analyzed all wagered responses as well as the first “No-Wager” attempt that initiates an iterative feedback cycle. Subsequent guided attempts within the iterative loop were excluded. Across both cohorts, the dataset included 18,391 such metacognitive responses.
From these logs we constructed several derived variables. Wager size was coded as large (100-point or All-In wagers) or small (0–75-point wagers and No-Wager entries). A response was coded as metacognitively aligned when students wagered large and were correct or wagered small and were incorrect. We also computed an On-track rate, defined as the proportion of aligned responses plus correct responses with small wagers—effectively capturing the extent to which students avoided overconfident errors.
Additional performance and demographic data were obtained from the course management system and university records. Course-level data included summative exam scores, two SQL quiz scores (combined into a standardized index), and homework scores (one of which was excluded due to near-zero variance). University record variables included cumulative GPA, earned engineering credit hours, the grade in the prerequisite programming course, and demographic indicators used in exploratory modeling. All institutional data were de-identified in accordance with IRB protocols.
Analytic Approach
Metacognitive Wagering and Response Accuracy (H1)
To test whether wager size predicted correctness after accounting for relevant contextual factors, we fit a mixed-effects logistic regression model with random intercepts for individual students. Fixed effects included wager category, question difficulty, question format, topic level, response time (log-transformed), division status (upper vs. lower), and correctness on the previous question within the same topic. This model assessed whether confidence judgments expressed through wagering served as reliable indicators of metacognitive monitoring.
Wagering Behavior and Summative Exam Performance (H2)
Because upper-division students scored substantially higher on the SQL exam, all analyses relating practice behavior to exam performance were conducted separately for the two cohorts. We first tested a targeted predictive model that included prerequisite course grade, the standardized quiz index, and alignment rate. To identify the most prominent predictors of exam performance, we applied LASSO stability selection across the full set of behavioral, course, and university-record variables, using 2,000 subsamples per cohort. Variables that met the cohort-specific selection frequency threshold were retained for the final regression model, which estimated the unique contribution of each predictor to exam performance while minimizing overfitting.
3. Results
Engagement and Performance
Sixty-six students generated 18,391 metacognitive responses (wagered responses plus first attempts in the iterative feedback loop). Students completed a median of 272.5 responses (IQR = 54.25; mean = 279). Pooled response accuracy was 71.1%; mean student-level accuracy was 72.1% (SD = 8.6%), with upper-division students outperforming lower-division students (76.3% vs. 69.8%; Table 1).
On the SQL portion of the summative assessment, the overall mean score was 83%. Upper-division students scored 90.4% (SD = 11.6%) on average, compared to 78.1% (SD = 16.4%) for lower-division students (Welch’s t(61.0) = –3.55, p < 0.001, Hedges’ g = 0.82; Table 2).
Wagering Behavior and Metacognitive Alignment (H1)
Descriptive Patterns
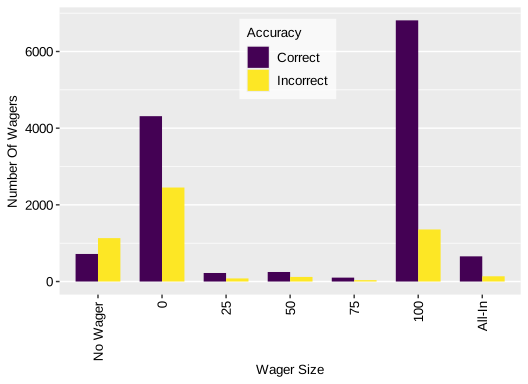
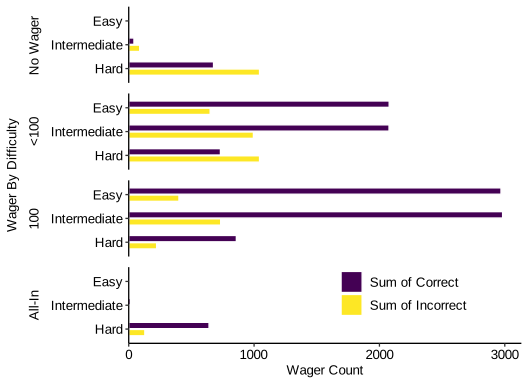
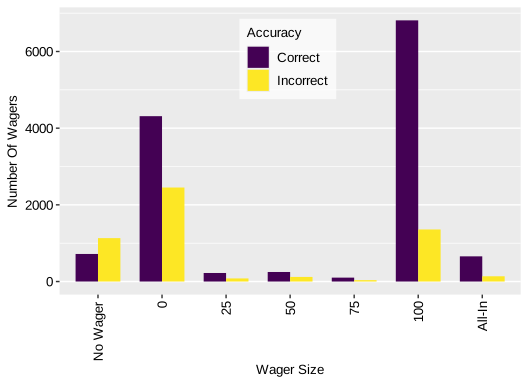
Wagering behavior was strongly bimodal. Across all metacognitive responses, the distribution was: No Wager 10.1% (n = 1,851), 0 points 36.8% (n = 6,765), 25 points 1.7% (n = 304), 50 points 2.0% (n = 369), 75 points 0.8% (n = 138), 100 points 44.4% (n = 8,170), and All-In 4.3% (n = 794). Because intermediate wagers (25–75 points) were infrequent (4.5% in aggregate), they were collapsed into a <100 group for most analyses (Figure 5, Figure 6).
__by_wager_value__difficulty__and_accuracy.svg)
Accuracy increased with wager size. In the consolidated wager groups, percent correct was:
-
No Wager: 38.8% (95% CI [36.6, 41.1])
-
<100: 64.5% (95% CI [63.4, 65.6])
-
100: 83.4% (95% CI [82.6, 84.2])
-
All-In: 82.7% (95% CI [80.0, 85.2])
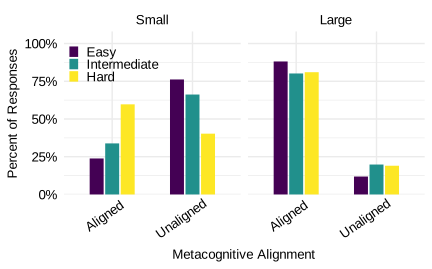
When No Wager and <100 were grouped as Small and 100 and All-In as Large (Table 3), accuracy was 59.5% for Small wagers and 83.3% for Large wagers. Thus, large wagers were associated with substantially higher accuracy than small wagers.
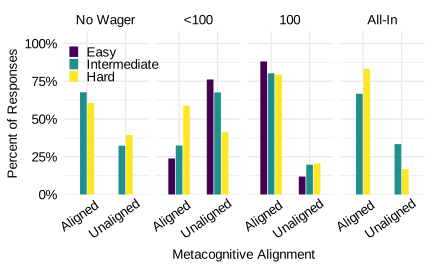
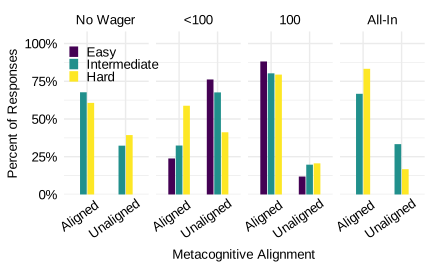
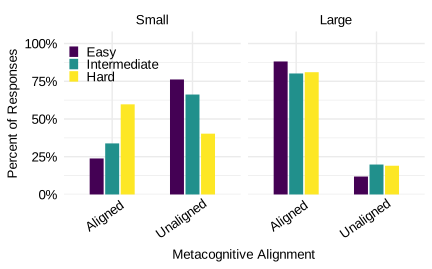
Metacognitive alignment, defined as large wagers when correct and small wagers when incorrect, was also patterned by wager size and difficulty (Figure 7, Figure 8). Overall, 61.4% of responses were aligned and 38.6% unaligned. Large wagers were predominantly aligned across difficulty levels (≥ ~80%), whereas small wagers were more often unaligned on Easy and Intermediate questions but became more aligned on Hard items.
Question-Level Modeling
To evaluate H1 while accounting for question and student characteristics, we fit a mixed-effects logistic regression predicting correctness from wager size and covariates (Table 4). The model was:
P(Y=1)=1/(1+e(−f(X)))
where Y is the probability of a correct response and is the linear predictor:
f(X)=β0+β1X1+β2X2+β3X3+β4X4+β5X5+β6X6+β7X7+β8(X5∗X6)+β9(X5∗X7)+β10(X6∗X7)+ui
where:
is the correctness on the previous question in the same topic (0/1),
is the student division (lower vs. upper),
is the topic level (Basic, Intermediate, Advanced),
is the natural log of the response time,
is the Wager Size (No Wager, 0, 25, 50, 75, 100, or All-In),
is the Question Format (open-ended vs. multiple-choice),
is the Question Difficulty level (Easy, Intermediate, Hard),
β0…β7 are the regression coefficients,
β8,β9,β10 are the interaction coefficients,
is the random intercept for student
Wager size remained a strong predictor of correctness after adjustment. Relative to 0-point wagers:
-
100-point wagers were associated with 2.84 times higher odds of correctness (95% CI [2.39, 3.37], p < .001).
-
All-In wagers were associated with 14.66 times higher odds of correctness (95% CI [11.49, 18.70], p < .001).
-
No Wager responses also showed modestly higher odds of correctness (OR = 1.33, 95% CI [1.11, 1.58], p = .002).
Intermediate wagers (25–75 points) did not show consistent significant main effects, reflecting their sparse and heterogeneous use.
Several covariates behaved as expected. The Temporal Dependency term indicates that a correct response on the previous question within the same topic increased the odds of correctness on the current response (OR = 1.43, 95% CI [1.32, 1.55], p < .001). Upper-division students had higher odds of correctness than lower-division students (OR = 1.42, 95% CI [1.11, 1.81], p = .005). Both Intermediate and Advanced topic levels showed higher odds of correctness than Basic, controlling for difficulty
Question difficulty and response time were also associated with performance. Hard questions substantially reduced the odds of correctness relative to Easy questions (OR = 0.44, 95% CI [0.36, 0.54], p < .001). Longer response times were associated with lower odds of correctness (OR = 0.82, 95% CI [0.78, 0.85], p < .001), consistent with longer deliberation reflecting uncertainty.
Format × difficulty interactions indicated that open-ended items became relatively more difficult than multiple-choice items at higher difficulty levels. Selected wager × difficulty interactions suggested that calibration varied somewhat by difficulty, but the overall pattern, higher wagers predicting higher correctness, was preserved.
Wagering and SQL Summative Assessment Performance (H2)
Because upper-division students scored substantially higher on the SQL exam, we modeled exam performance separately for lower- and upper-division cohorts.
Lower-Division Students
For lower-division students (n = 42), we first tested Hypothesis 2 using a targeted linear regression
yi=βo+β1x1,i+β2x2,i+β3x3,i+εi
where:
is the SQL exam score for student
is the intercept,
are the regression coefficients,
is the z-scored prerequisite course grade (Intro to Eng Computing),
is the z-scored SQL quiz index (scaled mean on the two low-stakes practice quizzes),
is the Wilson-adjusted, centered, and scaled Alignment Rate (proportion of aligned responses among metacognitive responses),
is the error term for each student and is normally distributed with mean zero and variance
In this initial model, alignment rate was negatively associated with exam performance (Table 5), contrary to the hypothesized direction.
In response to the negative association of alignment rate with exam performance and to better capture productive learning behavior, we defined an expanded metric: the On-track rate, comprising aligned responses (large-wager correct, small-wager incorrect) plus small-wager correct responses. Equivalently, On-track rate is 1 minus the rate of overconfident errors (large-wagers on incorrect responses).
We then applied LASSO stability selection over the full set of university-record, course, and Deliberate Practice Engine metrics. Features were ranked by selection frequency across 2,000 repetitions, with a selection frequency threshold of 0.65 and an upper bound of √n predictors. The resulting candidate set was used to build a final linear model for lower-division exam performance (Table 6).
The final model included:
-
Intro to Eng Computing grade (β = 0.055, SE = 0.017, p = .002)
-
SQL quiz index (β = 0.048, SE = 0.021, p = .029)
-
On-track rate (β = 0.667, SE = 0.260, p = .015)
-
Earned Engineering Credit Hours (β = 0.013, SE = 0.006, p = .025)
-
Wager-75 Accuracy (not statistically significant)
This model explained a substantial portion of variance (adjusted R² ≈ 0.51). The positive coefficient for On-track rate indicates that lower-division students who more frequently combined correct responses with appropriate wagering (including cautious correct responses) tended to achieve higher SQL exam scores.
Upper-Division Students
For upper-division students (n = 24), the same procedure was applied. The targeted alignment model (Table 7) did not yield significant effects of alignment rate, and LASSO stability selection did not identify any Deliberate Practice Engine metrics that met the selection threshold. Exam scores in this cohort were higher and less variable overall, which may have limited the ability of in-game behaviors to explain additional variance.
4. Discussion
This study examined whether a gamified deliberate practice platform with point-based wagering could serve as a behavioral probe of metacognition in undergraduate SQL learning and whether metacognitive wagering patterns would predict independent assessment outcomes. Results from 18,391 metacognitive responses across two course offerings yielded two main findings.
First, wager size was robustly associated with correctness. Descriptive analyses revealed a strongly bimodal wagering distribution and substantial differences in accuracy across wager bands, with large wagers (100 and All-In) being accurate more than 80% of the time and small wagers under 60% of the time. Mixed-effects logistic regression showed that these wager effects persisted after controlling for question difficulty, format, topic progression, student division, prior correctness, and response time. These patterns support the interpretation of wagering as a behavioral indicator of metacognitive monitoring, in line with theoretical accounts in which confidence judgments track perceived knowledge states.
Second, metacognitive practice indicators were meaningfully related to exam performance for lower-division students, but not for upper-division students. For the lower-division cohort, exam performance was best explained by a combination of prior computing performance (Intro to Eng Computing grade), SQL quiz performance, earned engineering credit hours, and the derived On-track rate. The On-track metric, which rewards both accurate responding and avoidance of overconfident errors, behaved as hypothesized: higher On-track rates were associated with higher SQL exam scores. For upper-division students, whose exam performance was higher and less variable, Deliberate Practice Engine metrics did not emerge as robust predictors.
The choice to move from the initial wager alignment metric to the on-track metric requires qualification. The wager alignment metric treated wagers of 0 points as low-confidence responses. However, the default wager was zero, so students ignoring the wagering mechanism was indistinguishable from genuine low-confidence wagering. This conflation likely introduced measurement noise and may have contributed to the unexpected negative correlation between performance and the wager alignment metric. In contrast, the On-track metric more directly captured metacognitive calibration: it credited correct responses, tolerated incorrect responses paired with low confidence, and penalized incorrect high-confidence responses. This structure better aligned the metric with calibrated performance rather than raw confidence expression.
Upper-division students showed minimal effects for either measure, likely due to restricted variance in exam performance. Additionally, because the course is typically taken in the sophomore year, non-sophomore students constituted a self-selected subgroup whose prior academic experiences may have influenced wagering behavior independently of metacognitive skill.
Taken together, these findings indicate that gamified confidence judgments can be harnessed as informative metacognitive signals in authentic disciplinary practice. Wagering decisions in the Deliberate Practice Engine were not arbitrary or purely motivational; rather, they aligned closely with correctness and shifted systematically with contextual and temporal information. Moreover, for students earlier in their programs, the way they combined accuracy and risk management during practice was associated with their performance on a separate, course-based assessment.
From a design perspective, the results suggest several implications for gamified deliberate practice systems:
-
Coarse, high-stakes confidence scales may be sufficient. The near absence of mid-range wagers and the strong calibration of large vs. small wagers suggest that a simplified wagering scheme can yield interpretable metacognitive data without requiring fine-grained confidence ratings.
-
Composite metrics such as On-track are useful for instructional decision-making. Because On-track integrates correctness and overconfidence, it could support dashboards that highlight students who are frequently overconfident (large wagers on incorrect answers) or persistently cautious despite high accuracy. Such analytics could enable targeted coaching around self-regulated learning.
-
Metacognitive practice may be especially valuable for early-stage learners. The fact that On-track predicted exam performance only for lower-division students suggests that metacognitive scaffolds embedded in deliberate practice may have their greatest impact when knowledge structures and learning habits are less established.
These contributions should be interpreted in light of several limitations. The study was conducted in a single course at one institution with a relatively small upper-division sample. The SQL module spanned a limited duration, and exam scores were only one indicator of learning. Wagering behavior may also be influenced by individual differences in risk preference, motivation, or familiarity with game mechanics. Although the models controlled for many observable factors, unmeasured variables may contribute to both wagering and performance.
Future research could examine how metacognitive wagering patterns evolve over longer courses or across multiple courses, how explicit instruction about wagering strategies affects calibration, and whether similar patterns appear in other domains (e.g., statistics, programming, or physics). It would also be informative to explore how wagering data can be integrated into real-time feedback, such as prompts triggered by overconfident errors.
5. Conclusion
The Deliberate Practice Engine’s wagering feature provided a rich, behaviorally grounded view of students’ metacognitive processes during SQL practice. Wager size was strongly and consistently related to correctness, both descriptively and in mixed-effects models, indicating that students used the wagering mechanism to express calibrated confidence rather than random guesses. Students also adjusted wagers based on recent performance, topic level, question format, and response fluency, demonstrating metacognitive regulation.
For lower-division students, a composite On-track metric that rewarded both accurate responding and avoidance of overconfident errors was positively associated with SQL exam performance, above and beyond prior coursework and quiz scores. For upper-division students, exam performance was not strongly predicted by Deliberate Practice Engine behaviors, likely reflecting higher baseline competence and reduced variability.
These results indicate that gamified deliberate practice with embedded wagering can support and reveal metacognitive processes in technical learning and that metacognitive practice features may be particularly beneficial for students early in their academic trajectories. Further, encouraging metacognitive alignment outside of gamified environments could benefit student performance, especially for lower division students.
Acknowledgements
We would like to acknowledge support from the University of Iowa Office of Teaching, Learning, and Technology (OTLT) Research & Analytics team. Their assistance with the IRB process and data preparation has been greatly appreciated.
We would also like to acknowledge the Hanson Center for Communication. Their assistance in keep progress focused is what allowed this article to be completed in a timely fashion.
ChatGPT 5.1 by OpenAI and Claude Sonnet 4.5 by Anthropic were used to 1) review and propose revisions to R code and 2) edit the prose for clarity and concision. All suggestions were checked by the authors, with code tested against the analysis outputs reported in this paper. The authors accept responsibility for the accuracy and integrity of all content. No AI generated content was accepted without human verification, and no AI system was used to generate data or figures.